I literally just discovered this last week and can’t believe I haven’t heard of it. Maybe I’ve been too deep in operations lately to hear about it, but Google launched Enhanced Ecommerce last May and it looks amazing. It requires some new tags and some work by your IT team but it looks to be well worth it. I’m still waiting on the implementation on my end but here are the basics as I understand it:
Product Performance Reports – For product performance you get the revenue, refunds, quantity sold, views, amount added to cart, amount removed from cart, number of unique purchases, and several other metrics. I’ve never had insight into specific items added to cart and then abandoned or removed so this will be really interesting to measure.
Here’s what I’m hoping to learn from this initially:
– Are there high abandonment rates on specific products? Why could that be?
– Are there products with high refund rates? Why might that be?
Product-list Performance Reports – This report will give you insights into the various product lists you have on your site as well as their positions on the screen. This means you can measure your recommendations, recently viewed, related, and any other product lists against each other and see if which products convert best on which list.
Here’s what I’m hoping to learn from this initially:
– Will certain lists convert better in different positions? What’s the optimal configuration here?
– Is the order of the products in lists also the order of sales rank? If not can I increase sales my making it that way?
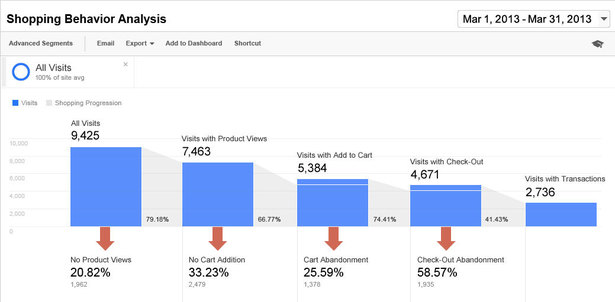
Shopping & Checkout Behavior Report – This is like a more detailed checkout funnel report. It tells you exactly how many users dropped off on each page of the checkout with a nice visualization. The checkout is always worth analyzing at length since marginal changes can result in huge improvements.
Here’s what I’m hoping to learn from this initially:
– Which pages represent the largest drop off? How can they be tweaked to improve?
– How much time is spent on each page? Is there a correlation to the drop offs? Is there anything causing confusion?
– How do different segments compare? What is the profile of a customer that drops off at the end of the funnel?
So without having dug in yet myself this is what I’m excited to check out. Have you already had a chance to set this up? I’d be grateful for any further tips on using this newish tool.